Zabbix3.0.4添加对Nginx服务的监控
一、
通过Nginx的http_stub_status_module模块提供的状态信息来监控,所以在Agent端需要配置Nginx状态获取的脚本,和添加key信息等,然后在Server端配置Nginx的监控模板等。请根据自己情况调整,这里只做简单的参照。
主要是使用Github这个项目的代码 zabbix-templates
检查Nginx是否安装了 http_stub_status_module 模块,通过下面的命令可以看到编译参数。
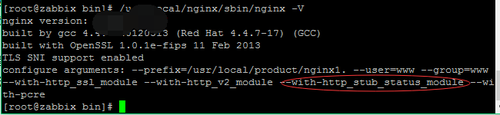
如没有http_stub_status_module 模块,请重新编译加上该模块
二、
配置nginx如下图
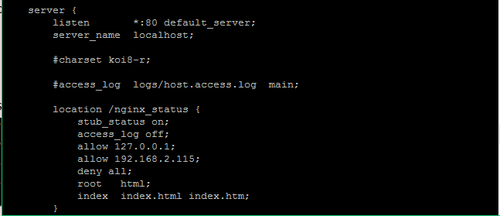
重启nginx /usr/local/nginx/sbin/nginx -s reload
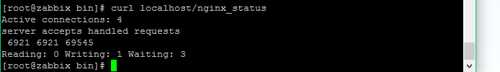
查看如下
三、
1.nginx脚本 cat nginx-check.sh


#!/bin/bash
##################################
# Zabbix monitoring script
#
# nginx:
# - anything available via nginx stub-status module
#
##################################
# Contact:
# [email protected]
# Zabbix requested parameter
ZBX_REQ_DATA="$1"
ZBX_REQ_DATA_URL="$2"
# Nginx defaults
NGINX_STATUS_DEFAULT_URL="http://127.0.0.1/nginx_status"
WGET_BIN="/usr/bin/wget"
#
# Error handling:
# - need to be displayable in Zabbix (avoid NOT_SUPPORTED)
# - items need to be of type "float" (allow negative + float)
#
ERROR_NO_ACCESS_FILE="-0.9900"
ERROR_NO_ACCESS="-0.9901"
ERROR_WRONG_PARAM="-0.9902"
ERROR_DATA="-0.9903" # either can not connect / bad host / bad port
# Handle host and port if non-default
if [ ! -z "$ZBX_REQ_DATA_URL" ]; then
URL="$ZBX_REQ_DATA_URL"
else
URL="$NGINX_STATUS_DEFAULT_URL"
fi
# save the nginx stats in a variable for future parsing
NGINX_STATS=$($WGET_BIN -q $URL -O - 2> /dev/null)
# error during retrieve
if [ $? -ne 0 -o -z "$NGINX_STATS" ]; then
echo $ERROR_DATA
exit 1
fi
#
# Extract data from nginx stats
#
case $ZBX_REQ_DATA in
active_connections) echo "$NGINX_STATS" | head -1 | cut -f3 -d‘ ‘;;
accepted_connections) echo "$NGINX_STATS" | grep -Ev ‘[a-zA-Z]‘ | cut -f2 -d‘ ‘;;
handled_connections) echo "$NGINX_STATS" | grep -Ev ‘[a-zA-Z]‘ | cut -f3 -d‘ ‘;;
handled_requests) echo "$NGINX_STATS" | grep -Ev ‘[a-zA-Z]‘ | cut -f4 -d‘ ‘;;
reading) echo "$NGINX_STATS" | tail -1 | cut -f2 -d‘ ‘;;
writing) echo "$NGINX_STATS" | tail -1 | cut -f4 -d‘ ‘;;
waiting) echo "$NGINX_STATS" | tail -1 | cut -f6 -d‘ ‘;;
*) echo $ERROR_WRONG_PARAM; exit 1;;
esac
exit 0
给脚本权限
chmod +x nginx-check.sh
2. agent的配置文件 /usr/local/zabbix-3.0.4/etc/zabbix_agentd.conf 中定义了其他key的包含目录
Include=/usr/local/zabbix-3.0.4/etc/zabbix_agentd.d/, 如果没有这个配置请自己添加下。接着在
/usr/local/zabbix-3.0.4/etc/zabbix_agentd.d/ 目录新建一个文件 nginx-params.conf, 内容如下


cat nginx-params.conf
UserParameter=nginx[*],/usr/local/zabbix-agent/scripts/nginx-check.sh "$1"
3.重启zabbix_agent
四、
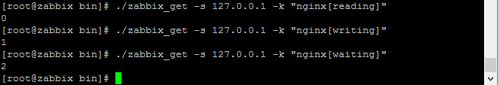
server端测试
web界面导入模板


在web端查看监控

注: 模板地址https://github.com/jizhang/zabbix-templates/blob/master/nginx/nginx-template.xml